Beep Test Decimal Score Calculator
Quick Answer
This calculator converts beep test scores between level.shuttle format (10.5) and decimal values for accurate team averaging. Spreadsheet programs misinterpret level.shuttle notation, requiring decimal conversion for proper calculations.
- Converts instantly between formats using official shuttle counts
- Calculates accurate team averages for coaches and trainers
- Based on the standard 20-meter multistage fitness test protocol
Why Convert Beep Test Scores to Decimals?
If you conduct the beep test on a large group of athletes, calculating the team average presents a unique challenge. When you use a spreadsheet program like Microsoft Excel or Google Sheets, it will interpret a score like level 10.10 as the decimal number 10.1. This fundamental misinterpretation makes accurate team averaging impossible without proper conversion.
According to sports science expert Robert Wood, who has analyzed sports performance data for over 25 years, the solution is to convert each level.shuttle score to its true decimal equivalent. This decimal represents the total number of 20-meter shuttles completed during the test. For example, an athlete who reaches level 10, shuttle 10 has actually completed 96 total shuttles - not 10.1 or 10.10.
How to Use the Beep Test Decimal Calculator
This calculator provides two essential functions for coaches, trainers, and athletic directors managing beep test data:
Single Score Conversion
- Select Conversion Direction - Choose whether you're converting from level.shuttle format to decimal, or from decimal back to level.shuttle format.
- Enter Your Data - For level.shuttle conversion, input both the level (1-21) and the number of shuttles completed at that level. For decimal conversion, simply enter the decimal value.
- Get Instant Results - Click Calculate to see the conversion. The result shows both formats and explains the total shuttle count for clarity.
- Use in Spreadsheets - Copy the decimal value into Excel, Google Sheets, or any analytics software for accurate mathematical operations.
Pro Tip: When recording beep test results for later analysis, immediately convert scores to decimals. This prevents data entry errors and ensures your team statistics remain accurate throughout the season.
Team Average Calculation
- Click "Team Averaging" - Access the advanced team calculation mode designed for batch processing multiple athlete scores.
- Enter Team Scores - Input one score per line. The calculator accepts multiple formats: 10.5, 10-5, or "Level 10, Shuttle 5" for flexibility during data entry.
- Calculate Team Statistics - Get comprehensive team metrics including average score (in both formats), highest and lowest performers, and score distribution range.
- Export Results - Download team data as CSV for record keeping, print formatted reports, or share results with athletic staff.
Understanding Beep Test Decimal Scores
The Mathematics Behind the Conversion
The beep test uses a progressive structure where each level contains a specific number of shuttles. Robert J. Wood's research at Topend Sports documented the official shuttle counts for each level of the standard 20-meter multistage fitness test:
- Levels 1-3: 7, 8, 8 shuttles respectively
- Levels 4-5: 9 shuttles each
- Levels 6-7: 10 shuttles each
- Levels 8-10: 11 shuttles each
- Levels 11-12: 12 shuttles each
- Levels 13-15: 13 shuttles each
- Levels 16-17: 14 shuttles each
- Level 18: 15 shuttles
- Levels 19-21: 15, 16, 16 shuttles respectively
To calculate the decimal value, sum all shuttles from completed levels, then add the shuttles completed in the final partial level. For example, an athlete reaching level 10, shuttle 5 has completed:
Calculation Example:
- Levels 1-9: 7+8+8+9+9+10+10+11+11 = 83 shuttles
- Level 10, shuttle 5: +5 shuttles
- Total: 88 shuttles (decimal value = 88)
Common Decimal Values for Athletic Standards
Understanding typical performance ranges in decimal format helps coaches set realistic team goals and identify athletes requiring additional conditioning:
Entry Level Athletes
Level 7.5 = 73 shuttles decimal
Typical for military recruits and beginning athletic programs
Competitive Athletes
Level 10.8 = 94 shuttles decimal
Standard for college team sports and competitive fitness levels
Elite Athletes
Level 13.10 = 133 shuttles decimal
Professional athletes and special forces personnel achieve these scores
Sport-Specific Applications for Decimal Scoring
Team Sports Requiring High Aerobic Capacity
Soccer/Football: Professional soccer teams typically target team averages between 110-130 decimal (approximately level 11-13). Midfielders often score highest with decimals of 120-140, while defenders average 105-120. According to data compiled by Robert Wood, PhD, elite Premier League squads maintain team averages above 125 decimal during pre-season testing.
Rugby Union: Backs average 115-135 decimal (level 11.5-13.8), while forwards typically range from 95-115 decimal (level 10.2-11.7). The intermittent nature of rugby makes the beep test particularly relevant for position-specific conditioning programs.
Basketball: NCAA Division I teams typically average 105-120 decimal. Guards generally outscore centers by 10-15 decimal points due to greater running demands. Professional teams target minimums of 100 decimal for all positions.
Military and Emergency Services Standards
Military Personnel: Army recruits must achieve minimum 73 decimal (level 7.5), while special forces require 96+ decimal (level 10+). Elite units like Navy SEALs regularly exceed 120 decimal during selection processes.
Police and Firefighters: Police officers typically need 68-83 decimal (level 5.5-7.5) depending on role and jurisdiction. Firefighters face higher standards of 88-98 decimal (level 8-9) due to the cardiovascular demands of wearing heavy equipment during emergency response.
Using Team Averages for Program Design
Research by Robert Wood indicates that tracking team average decimal scores throughout a season provides valuable insights into conditioning program effectiveness:
- Pre-Season Baseline: Establish team average to identify athletes needing additional conditioning focus
- Mid-Season Monitoring: Team average should remain stable or improve by 3-5 decimal points with proper training
- Post-Season Assessment: Compare final team average to baseline to evaluate program success
- Year-Over-Year Tracking: Elite programs show consistent team average improvements of 5-8 decimal points annually
Excel Formulas for Automated Decimal Conversion
For coaches managing large athletic programs, implementing automated conversion formulas in Excel streamlines data management. Based on the official shuttle count table, you can create lookup formulas that convert scores automatically:
Excel Setup Instructions
- Create a reference table with levels 1-21 and corresponding cumulative shuttle counts
- Use VLOOKUP to find the cumulative shuttles for the completed level
- Add the partial shuttle count from the final level
- Result gives the accurate decimal value for any level.shuttle score
Note: This calculator eliminates manual formula creation - simply copy decimal values directly into your spreadsheets.
Interpreting Team Performance with Decimal Scores
Setting Realistic Team Goals
When establishing team fitness targets, decimal values provide precise, measurable objectives. As Robert Wood, founder of Topend Sports, notes in his analysis, successful programs set incremental goals based on current team average:
- Beginning Programs: Target 5-8 decimal point improvement over 8-12 weeks
- Established Programs: Aim for 3-5 decimal point gains during pre-season
- Elite Programs: Maintain team average above sport-specific thresholds throughout competitive season
Identifying Training Needs
Team decimal statistics reveal conditioning gaps requiring attention:
- Large Score Range (>30 decimal difference): Indicates need for differentiated conditioning groups
- Low Team Average (below sport standard): Suggests inadequate aerobic base development
- Declining Mid-Season Scores: May indicate excessive training load or insufficient recovery
- Stagnant Year-Over-Year Averages: Training program requires modification for continued adaptation
Original Decimal Reference Table
Below is the complete reference table showing every possible beep test score and its corresponding decimal value. This table was compiled by Robert Wood based on the official shuttle counts for the standard 20-meter multistage fitness test:
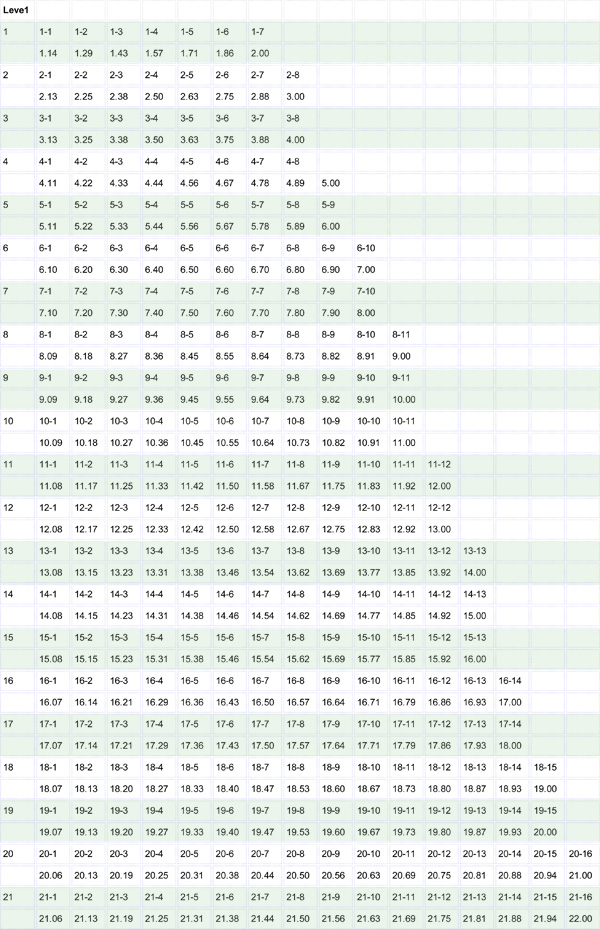
The calculator above provides instant conversion without requiring manual table lookup, making it ideal for real-time use during testing sessions and immediate team analysis.
Frequently Asked Questions
Why do I need to convert beep test scores to decimals?
Spreadsheet programs like Excel automatically interpret scores in level.shuttle format (such as 10.10) as decimal numbers (10.1), which creates inaccurate calculations. Converting to true decimal values based on total shuttles completed ensures mathematical accuracy when calculating team averages, tracking progress over time, or performing statistical analysis on athletic performance data.
How do you calculate a team average for beep test scores?
First convert each athlete's level.shuttle score to its decimal equivalent using the total shuttles completed. Add all decimal values together and divide by the number of athletes tested. For example, if five athletes score decimals of 88, 92, 85, 96, and 90, the team average is 90.2 decimal (450 total shuttles ÷ 5 athletes), which equals approximately level 10.1.
What is the decimal value of level 10.10 on the beep test?
Level 10, shuttle 10 equals a decimal value of 96, representing 96 total 20-meter shuttles completed. This is significantly different from how Excel would interpret "10.10" as the decimal number 10.1, demonstrating why proper conversion is essential for accurate record-keeping and team analysis.
Can I convert decimal scores back to level.shuttle format?
Yes, the calculator provides bi-directional conversion. Simply select "Decimal → Level.Shuttle" from the dropdown menu and enter your decimal value. The calculator automatically determines which level and shuttle number corresponds to that total shuttle count, making it useful for setting training targets based on decimal averages.
What's a good team average decimal score for high school athletes?
High school varsity athletes in aerobic sports typically average 85-105 decimal (approximately level 9-11), depending on sport and training program quality. Soccer and lacrosse teams often exceed 95 decimal, basketball teams average 90-100 decimal, while baseball and softball teams may range 75-90 decimal due to different conditioning demands.
How many shuttles are in each level of the beep test?
Shuttle counts vary by level: Level 1 has 7 shuttles, levels 2-3 have 8 each, levels 4-5 have 9 each, levels 6-7 have 10 each, levels 8-10 have 11 each, levels 11-12 have 12 each, levels 13-15 have 13 each, levels 16-17 have 14 each, level 18 has 15, and levels 19-21 have 15, 16, and 16 shuttles respectively. The calculator uses these official counts for all conversions.
Should I record beep test results in level.shuttle or decimal format?
Record both formats whenever possible. Use level.shuttle (e.g., 10.5) for immediate athlete feedback and comparison to normative standards, but also record the decimal value (91) for accurate database storage, statistical analysis, and team averaging. This dual-recording approach ensures data integrity while maintaining athlete-friendly communication.
References
- Léger, L.A., Mercier, D., Gadoury, C., & Lambert, J. (1988). "The multistage 20 metre shuttle run test for aerobic fitness." Journal of Sports Sciences, 6(2), 93-101.
- Ramsbottom, R., Brewer, J., & Williams, C. (1988). "A progressive shuttle run test to estimate maximal oxygen uptake." British Journal of Sports Medicine, 22(4), 141-144.
- Wood, R.J. (2015). "Beep Test Decimal Conversion Tables." Topend Sports.
- Tomkinson, G.R., Lang, J.J., & Tremblay, M.S. (2019). "Temporal trends in the cardiorespiratory fitness of children and adolescents representing 19 high-income and upper middle-income countries between 1981 and 2014." British Journal of Sports Medicine, 53(8), 478-486.
- LeBlanc, A.G., et al. (2016). "Correlates of total sedentary time and screen time in 9-11 year-old children around the world: The International Study of Childhood Obesity, Lifestyle and the Environment." PLOS ONE, 10(6).
Related Pages
Beep Test Calculator (VO2max)
Convert your beep test level to estimated VO2max score with fitness ratings
Calculate VO2max →Free Beep Test Download
Download the official 20m shuttle run test audio file (male voice)
Download Audio →